Performance testing with insights into JaxWS client scalability
In my day job we recently finished a performance testing session and had some interesting insights that I’d like to share here. To set the scope for this article I’m using Grig Gheorghiu’s definition of load vs performance vs stress testing. Basically performance testing is done to make sure you achieve the performance figures that business wants - e.g. a throughput of 10k per minute for a certain entity. In the process you will find out what your biggest bottlenecks are and hopefully eliminate them to finally meet or overachieve your requirements.
Setup
Our application is picking up events from a database table, fetches some data from other tables and sends out a soap web service request to a third party. We use the java executor framework to get a threadpool for these event workers and played with the threadpool size to find out how our application scales up. To get the timings of the individual components (and thereby identify bottlenecks) we used JETM. You can plug it into your application and see invocations, average execution etc. in a nice web console. To focus the test on our own application we set up a little mock web service that emulates the third party service.
Technology stack
- JVM 1.6.0
- Oracle 10g
- JPA with Hibernate as persistence provider
- JBoss 4.2.3-GA
- jbossws-metro-3.1.0.GA
- JAX-WS RI 2.1.4
- JAXB RI 2.1.9
- WSIT 1.3.1
First test iterations: fun with JaxWS
In the first run it quickly became obvious that we had a major bottleneck that made it impossible for us to achieve the required throughput. Using VisualVM it didn’t take long to identify the initialisation of the JaxWS service port as the culprit. That class basically just holds some meta information about the service in order to call it correctly (e.g. security policies). Turns out it’s a really bad idea to create a new instance for every request, as JaxWS will go out and fetch the WSDL from the remote service every single time. The obvious solution is to cache the instance and share it among the event worker threads. However old versions of JaxWS were not thread safe and it is still in the dark when and where this was fixed. To be on the safe side we performed some massive loads and checked that all generated messages were schema compliant.
Cleaning up our own backyard: JPA query optimisation
With this major bottleneck out of the way we were able to find some database performance problems in our own application code. This is the sort of bottleneck we expected, especially as we use JPA which abstracts the database away and thereby it is easy to oversee bad-performing database queries. Yes, you should have a look at the actual queries in the log and check if that’s what you actually want to run. Often there are too many joins resulting in data being fetch unnecessary, or not enough joins resulting in more queries than necessary, to only name some common problems. But analysing the queries from the log only gets you so far. Database statistics are your friend if you want to find out how the database behaves under high load, identify the slowest performing queries and those with the most CPU time overall. They help you focus the optimisation efforts on the important parts: those 2% of your code that make all the difference. This way we found a couple of slow performers that constituted the bottlenecks. Once identified and with the help of the database statistics and some explain plans it was straightforward to resolve them. These are the most noteworthy changes we made:
- make sure they use an index
- configure cascade operations for more efficient updates and merges
Why synchronised parts matter
With these improvements in place we played with the threadpool size again and now captured the following execution times:
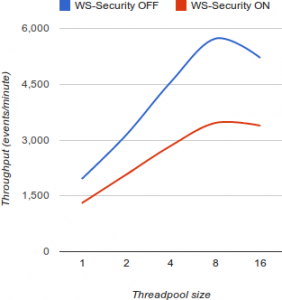
Throughput (events/minute)
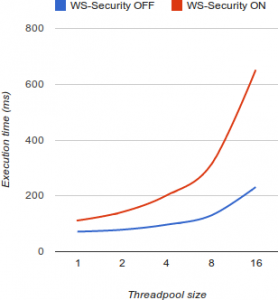
Average client execution time
As you can see the client doesn’t scale any higher when using more than 8 threads. If you throw more threads at it, the average invocation time increases, resulting in no higher throughput. Also note that the WS-Security overhead does have a huge impact in the complete turnaround time (as we expected), but at least it doesn’t make the client scale even worse ;)
In an ideal world (without synchronisation), scaling up an application is easy: just increase the number of concurrent workers and give them enough resources. If you double the amount of workers, the average execution time will remain pretty stable, resulting in roughly the double throughput for double number of concurrent workers. This is why frameworks like Node.js are becoming so popular these days: they scale up perfectly because they don’t have any synchronised parts.
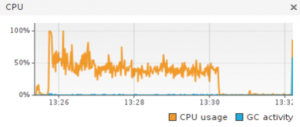
Scaling up obviously only works as long as there are still enough resources available, therefore we monitored the servers with VisualVM. The graphs show that the CPU usage is constantly around 60%, no matter if 8 or 16 workers are active. The additional threads can’t make more use of the available resources because they obviously wait outside some synchronised blocks. With more workers the graph is only more volatile which results in slightly worse performance because the garbage collector is running more often.
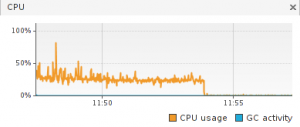
Threadpool size: 1
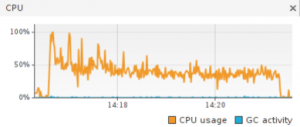
Threadpool size: 2
Threadpool size: 4
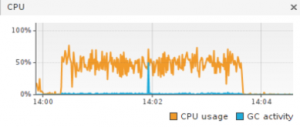
Threadpool size: 8
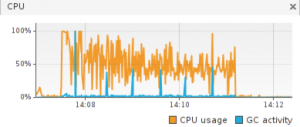
Threadpool size: 16
Making sure we blame the right one
While the figures seem to indicate that the JaxWS RI client doesn’t scale up well, the bad performing part could aswell be the service - especially as four servers with multiple concurrent threads are hammering at only one machine that hosts the service. So we set up a second machine with the same mock service and got the same results. It appears that the JaxWS RI service side of things are pretty much optimised - at least some effort has gone in there. But as our results show, the client part needs attention. Maybe the problem is in some library that’s used under the hood and maybe it has been improved in a later version, but I haven’t found anything in that direction.
Can we increase the throughput anyway?
To scale up we would have to resolve our bottlenecks. So we could use a different web services framework that scales up better (if that exists). But changing one main component in the architecture could have a lot of implications - luckily there is a second option: Scale out (scale horizontally), that is to come up with more servers for the same job. But the architecture must cope with that scenario. In our case all servers fetch events from the same database table. So we have to ensure that any two servers will never work on the same event, essentially by using the database table like a queue. To achive that every worker instance tries to lock a number of events and processes them only if the lock was acquired - if not, it tries to lock the next batch of events.
Conclusion
Our performance testing session was a great excercise that helped in resolving bottlenecks, thereby increasing the throughput of our application and finally overachieving the requirements we were given. While that’s great it is a bit disappointing that we can’t scale up any higher because we happen to use JaxWS RI. On a more positive note, there are two strategies to increase the throughput if performance requirements are growing in the future: scale out or move away from JaxWS RI. In my eyes these results are also another hint that besides the long lasting hype for soap web services in the past, implementations are still not as mature as general use HTTP/REST clients. Those are much longer around, more widely used and tested than soap frameworks. Therefore chances are higher that you will find one that scales up good enough for your needs.